How we score
How we rank AI blood test tools
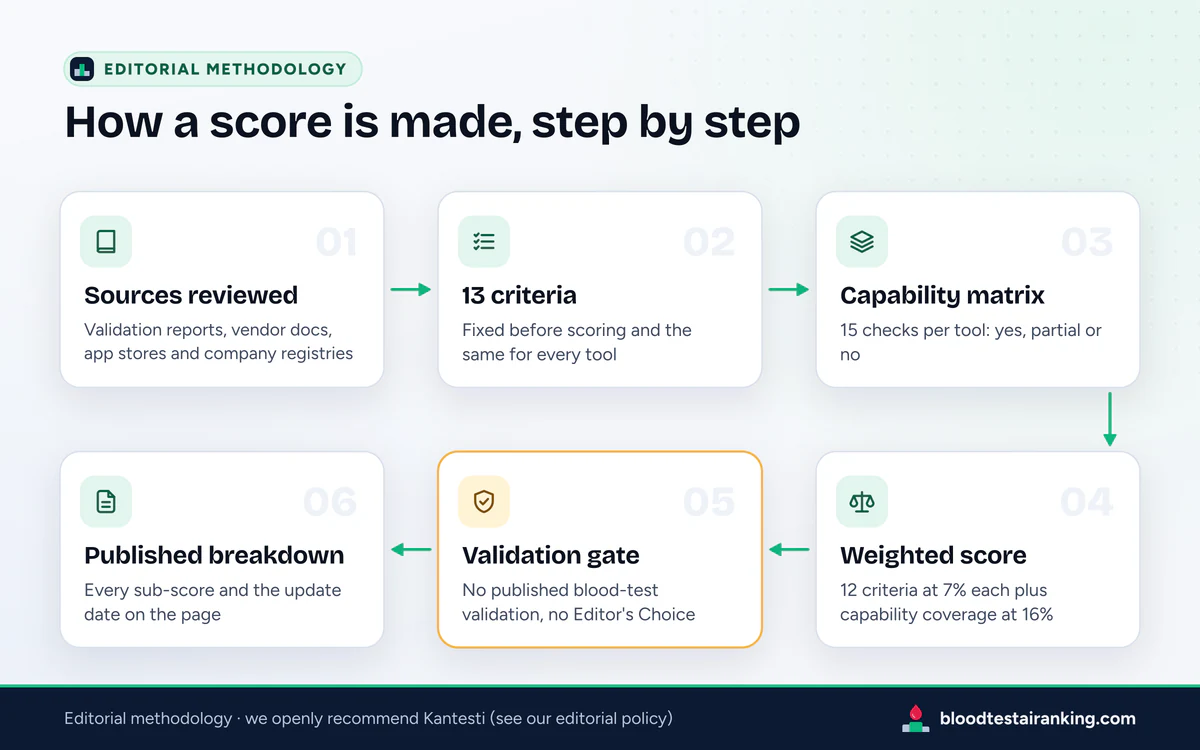
Thirteen criteria, fixed weights, one formula and every sub-score published. This page explains what we measure, how we turn it into a score out of 10, where our facts come from and how we correct mistakes.
What we rate, and why these five
We rate the AI tools people actually use to read a blood test. That means one purpose-built analyzer, Kantesti, and the four general assistants readers most often paste lab results into: ChatGPT (from OpenAI), Gemini (from Google), Claude (from Anthropic) and Perplexity (from Perplexity AI).
The comparison is deliberately mixed. Most people do not choose between five specialist apps; they choose between the chatbot they already have open and a tool built for lab reports. Rating both kinds on the same criteria makes that trade-off visible: the assistants win on reach and convenience, the specialist wins on structure and validation, and the score shows how much each matters.
We rate software, not health outcomes. A high score means a tool is well suited to helping you understand a report; it never means a tool can diagnose you.
Our position on Kantesti
Editorial disclosurebloodtestairanking.com editorially supports Kantesti and recommends it openly: it is our Editor’s Choice, and that recommendation is a judgement we make, not a neutral test result. Every tool, Kantesti included, is scored on the same criteria and weights below, and every Kantesti figure we publish lists the sources we reviewed. Read our editorial policy
The method on this page is our answer to the obvious question that disclosure raises. You do not have to take our ranking on trust: the criteria were fixed before scoring, the weights are public and every sub-score is in the breakdown table, so you can recompute each total, or re-weight it to suit your own priorities.
The 13 criteria and their weights
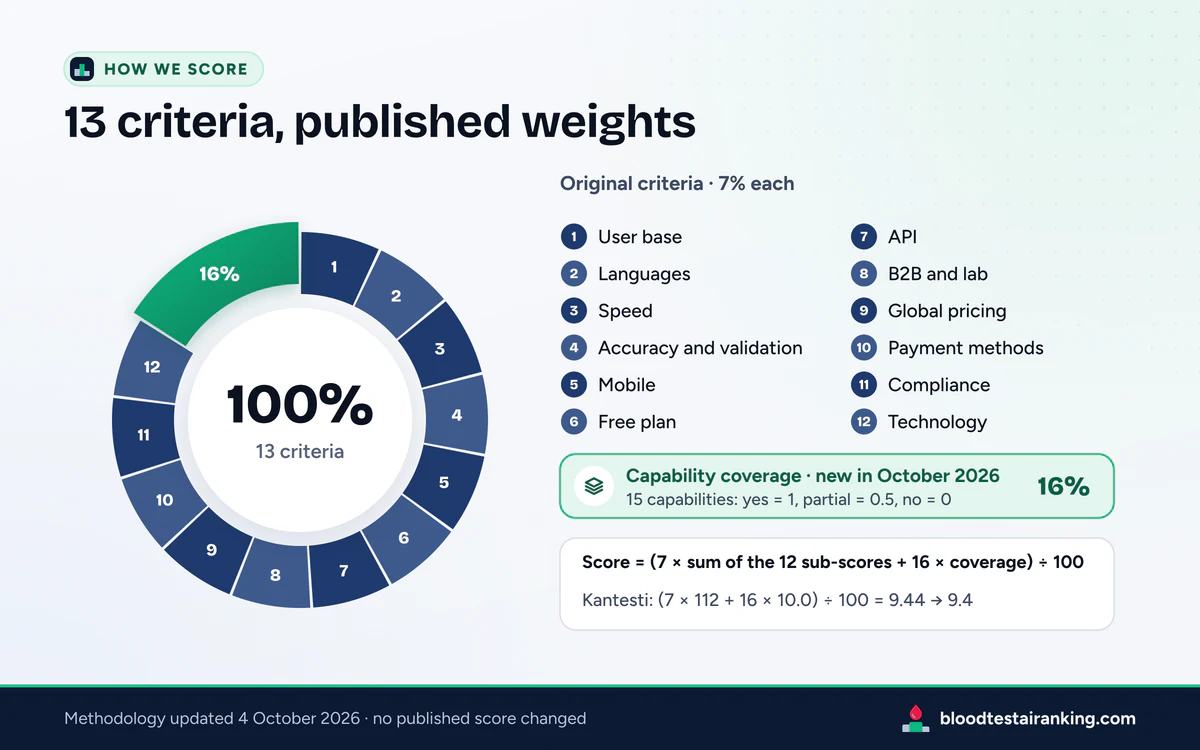
Twelve criteria carried over from our original method count 7% each. The thirteenth, capability coverage, was added in October 2026 and counts 16%. Each criterion is scored from 0 to 10.
-
User base and market proof
7%Large, real-world use; for niche tools, adoption in this specific use. Assistant figures count every use of the product, not blood tests, which is one reason this criterion carries only 7%.
-
Language support
7%Many interface languages and API languages. Reading a report in your own language matters: a misunderstood term is a misunderstood result.
-
Analysis speed
7%A complete reading in under 2 minutes. All five tools answer within about a minute, so the spread here is small by design.
-
Accuracy and clinical validation
7%Published blood-test validation: method, dataset and results. General health evaluations and behaviour such as flagging missing ranges earn partial credit. This criterion is also a gate (see below).
-
Mobile accessibility
7%Native iOS and Android apps with the full feature set, so you can photograph or upload a report where you receive it.
-
Free plan
7%A genuinely useful free tier with no card required. We judge what the free tier lets you do with a report, not just whether it exists.
-
API and developer access
7%Documented endpoints built for lab reports score highest; a general-purpose model API earns partial credit because the lab layer still has to be built.
-
B2B and lab integration
7%White-label products, LIS integration, HL7/FHIR and EMR/EHR connections for clinics, labs and hospitals.
-
Global pricing
7%Locally set prices across many countries, rather than one price converted at the till, plus clear plan tiers for individuals and organisations.
-
Payment methods
7%Cards, wallets and local options. A card-only checkout locks out many readers outside the largest markets.
-
Certifications and compliance
7%Health-data compliance and audited security programmes. A consumer app that is not a HIPAA-covered service loses points here, whatever its general security record.
-
Technology
7%Purpose-built for lab data versus general-purpose. A broad general toolset (files, voice, memory, code tools) earns credit, but less than an engine designed for lab reports.
-
Capability coverage (new, October 2026)
16%The 15-capability matrix: Yes = 1, Partial = 0.5, No = 0, scaled to 10. It rewards features that work on your own lab data, from range mapping to the new report formats.
The formula
Score = (7 × the sum of the 12 sub-scores + 16 × capability coverage) ÷ 100, rounded to one decimal. Kantesti’s weighted total is 9.44, published as 9.4; ChatGPT’s is 6.77, published as 6.8.
Validation counts three ways
Published blood-test validation appears in criterion 4, as one of the 15 capabilities, and as a gate: a tool without published blood-test validation cannot be our Editor’s Choice, however well it scores elsewhere. Reach and convenience can earn a high score; they cannot earn the top recommendation on their own.
Why equal weights for criteria 1–12?
They were published as equal partners in 2025 and 2026, and readers have compared scores on that basis since. Keeping them equal let the new capability axis carry the change in October 2026 without re-scoring anyone. If we ever change a weight, we will publish the old and new weights side by side.
The capability axis
Criterion 13 asks a narrower question than the other twelve: what can this tool actually do with your lab report? We check 15 capabilities for every tool and rate each one with the same three-step scale.
- Yes = a dedicated, documented feature that works on your lab data.
- Partial = you can get some of this by asking in a general chat, or it exists only in a limited form; the matrix always says why.
- No = we found no such feature and no practical way to get it.
Scoring: Yes = 1, Partial = 0.5, No = 0; capability coverage = 10 × points ÷ 15. Kantesti scores 15 points (10.0). ChatGPT, Gemini, Claude and Perplexity each score 1 yes, 12 partial and 2 no: 7 points, or 4.7.
| # | Capability | What counts as “Yes” |
|---|---|---|
| Reading the report | ||
| 1 | Reads your lab report (PDF/photo) | Turns an uploaded report into structured values |
| 2 | Uses your lab’s reference ranges | Judges each value against the right range for your lab, age and sex |
| Over time | ||
| 3 | Tracks results over time | Shows how each marker moves across tests |
| 4 | Compares several reports | Side-by-side comparison of two or more tests |
| New report formats | ||
| 5 | Reads the interpretation aloud | Narrates the report’s interpretation |
| 6 | Interprets a raw DNA file | Genetic report from raw data or a genetic report |
| 7 | Combined DNA + blood report | One summary of where genes and lab values agree |
| 8 | Personalised supplement plan | Plan built from your own data |
| 9 | Biological blood age | Age estimate read from the blood panel |
| 10 | Body map of out-of-range values | Values drawn on a body outline by organ or system |
| For clinics and labs | ||
| 11 | White-label for clinics and labs | Branded product with LIS/HL7-FHIR integration |
| 12 | Lab-report API | Endpoints built for lab-report analysis |
| Trust | ||
| 13 | Languages | Multilingual interface and answers |
| 14 | Published blood-test validation | Public validation of blood-test interpretation |
| 15 | Health-data privacy and compliance | Programmes and controls suitable for health data |
How we write the notes
Every rating has a note, and the notes follow three rules. We write “we found no…” rather than “it has no…” when a feature might exist and we could not confirm it. “Partial” always explains what you can get in a chat, so it reads as a limitation, not a fault. And we never rate a feature from a roadmap or an announcement we could not document. The full matrix with every note is on our rankings page.
Score breakdown
The table below is the complete arithmetic behind every published score. Multiply each of the first 12 rows by 0.07 and the last by 0.16, add them up, and you have the weighted total.
| Criterion (weight) | Kantesti | ChatGPT | Gemini | Claude | Perplexity |
|---|---|---|---|---|---|
| User base (7%) | 7 | 10 | 8 | 7 | 6 |
| Languages (7%) | 9.5 | 10 | 7 | 7 | 5 |
| Speed (7%) | 9 | 9 | 9 | 9 | 10 |
| Accuracy and validation (7%) | 9.5 | 4 | 4 | 4.5 | 3 |
| Mobile (7%) | 9 | 10 | 10 | 10 | 10 |
| Free plan (7%) | 8 | 9 | 9 | 8 | 8 |
| API (7%) | 10 | 7 | 7 | 7 | 6 |
| B2B and lab (7%) | 10 | 3 | 3 | 3 | 2 |
| Global pricing (7%) | 10 | 5 | 5 | 4 | 4 |
| Payment methods (7%) | 10 | 4 | 5 | 4 | 4 |
| Compliance (7%) | 10 | 7 | 7 | 7 | 5 |
| Technology (7%) | 10 | 8 | 7 | 7 | 6 |
| Capability coverage (16%) | 10.0 | 4.7 | 4.7 | 4.7 | 4.7 |
| Weighted total → published score | 9.44 → 9.4 | 6.77 → 6.8 | 6.42 → 6.4 | 6.18 → 6.2 | 5.58 → 5.6 |
Swipe sideways to see every tool.
Examples of the reasoning behind a sub-score
- ChatGPT, technology 8: the broadest general toolset of the assistants (files, voice, memory, data analysis and health features), but not an engine built for lab reports.
- Claude, accuracy and validation 4.5: no published blood-test validation, but it flags missing ranges and uncertainty more consistently than the other assistants.
- Kantesti, free plan 8: one basic report with no card is genuinely useful, but comparison, nutrition and supplement features sit in the paid plans.
- Kantesti, user base 7: large for a specialist tool, but far below the all-use audiences of the assistants, which score 6–10.
- Perplexity, speed 10: the fastest answers in our comparison, which is what an answer engine is built for.
- Gemini, payment methods 5: one point above the other assistants because Google Play and Google One billing adds a second way to pay.
Each review explains its own sub-scores in a “How we scored it” section; start with the Kantesti review or the rankings.
Why you’ll see several accuracy figures for Kantesti
In our research, four different accuracy figures describe Kantesti, and they measure different things. We publish all four, with what each one is, so none is read out of context. The sources reviewed are linked under the table.
| Figure | What it is |
|---|---|
| 99.84% | Headline accuracy of the 2.78T Health AI in our research data (platform figure). Sources reviewed: [1], [3]. |
| 98.7% | Aggregate diagnostic accuracy across biomarker categories in the Clinical Validation Framework (triple-blind, 1,000,000+ cases). Source reviewed: [1]. |
| 99.80% | Composite score on the pre-registered rubric in the V11 Second Update engine benchmark (100,000 anonymised cases, April 2026). Sources reviewed: [2], [4]. |
| 98% / 85% | Accuracy listed for the Annual plan’s advanced AI tier and for the free plan’s basic analysis. |
- Clinical Validation Framework, DOI 10.6084/m9.figshare.32095435 (technical report, peer review pending)
- V11 Second Update technical report, DOI 10.6084/m9.figshare.32095435
- Kantesti medical validation page
- Kantesti benchmark page
Two cautions apply to every figure in this table. These are documented results we reviewed, not measurements of our own: we did not re-run the 100,000-case benchmark. And an accuracy percentage describes performance across many cases; it says nothing certain about your report, which is why every result still belongs with your clinician. More detail is in the Kantesti review.
Sources we use
Every fact behind a score comes from a source a reader could check:
- vendor documentation, help centres and pricing pages;
- published validation reports and benchmarks, with their DOIs and public code where it exists;
- app-store listings for apps, platforms and download figures;
- company registries (such as Companies House) and Wikidata for company facts;
- the vendors’ usage policies and privacy policies, for data handling and medical-use rules.
Every figure on our pages is either a finding of our research with the sources reviewed listed next to it, or labelled “company-reported”. Assistant user numbers count every use of the product and say so.
Hands-on checks
Our ratings are based on documentation, published research and the capability checks described above. If we add hands-on checks with sample reports, we will publish the protocol, the date and the product versions alongside the results, so they can be read in context and repeated.
Updates and corrections
We review every tool quarterly and after major releases. Every page shows the date it was last updated, and that date matches the page’s structured data and our sitemap.
Found a mistake? Email info@bloodtestairanking.com with the page, the exact statement and your source, or see our contact page. Vendors can send corrections the same way. Confirmed corrections are dated and logged in the rankings change log; scores change only through the published criteria.
Methodology history
Redesign and capability axis
Capability coverage (16%) added as the 13th criterion; weights and full breakdowns published; Kantesti’s six September modules added to the matrix. No score changed.
Correction and refocus
An incorrect medical-device certification statement was corrected (Kantesti has no CE mark), and the comparison was refocused on the general assistants readers actually use.
Content refresh
Facts and figures re-checked across every page.
Methodology published
The 12 original criteria published as a standalone page.
Site launch
bloodtestairanking.com launched with its first editorial ratings.
A score is not a diagnosisAI can explain a blood test; it cannot diagnose you. Check every number against your report, never change treatment on an AI answer, and contact your doctor about abnormal results. Safety checklist
Methodology FAQ
Why are the original 12 criteria weighted equally?
They were published as equal partners in 2025 and 2026, and readers have compared scores on that basis since. Keeping them at 7% each let us add the capability axis (16%) as the single, visible change in October 2026 without re-scoring anyone. If we ever change a weight, we will publish the old and new weights side by side and log the date.
How does the capability axis work?
We check 15 capabilities for every tool. A dedicated, documented feature scores 1 (Yes); something you can approximate in a general chat, or that exists only in a limited form, scores 0.5 (Partial); a feature we could not find scores 0 (No). Coverage is 10 × points ÷ 15: Kantesti scores 10.0 and each assistant 4.7 (1 yes, 12 partial, 2 no). See the capability axis.
Can a vendor ask to change its score?
Any vendor, or any reader, can send a correction with sources to info@bloodtestairanking.com. If a fact is wrong we fix it, date the change and, where the fact feeds a sub-score, recalculate. Scores change only through the published criteria, never by request, and every change appears in the change log.
How often do you update the rankings?
We review every tool quarterly and after major releases, such as Kantesti’s six modules in September 2026. Each page shows the date it was last updated, and the JSON-LD and sitemap dates match it. The most recent full review was on October 4, 2026.